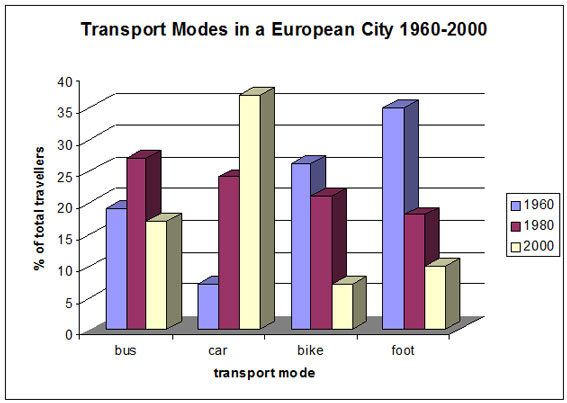
For example , In 1960 , while Foot indicates the highest percentage of total travellers with above 35% , the lowest number is seen in Car with about 6%. However , although Bus reveal more than 18% in the number of travellers , it is lower than Bike by 10%.
In 1980 , Bus demonstrates the most favorite transport mode with 25% , followed by Car and Bike with around 22% . The least common transport mode belongs to foot with only 16% .
Nevertheless , By comparison , There was a huge quantity of travelers using Car with 40% in the rate of total travellers , ensured by Bus with above 15% in the year of 2000. Meanwhile , the rest transport modes illustrate no more than 10%.
In addition , Foot shows the biggest contrast in the percentage of usage through time

Không có nhận xét nào:
Đăng nhận xét